Monitor Deployments and Metrics
The GlobalAI platform provides a centralized view to monitor the health, configuration, and resource efficiency of your Kubernetes deployments. This allows you to validate consistency across environments and optimize infrastructure costs.
View deployment status
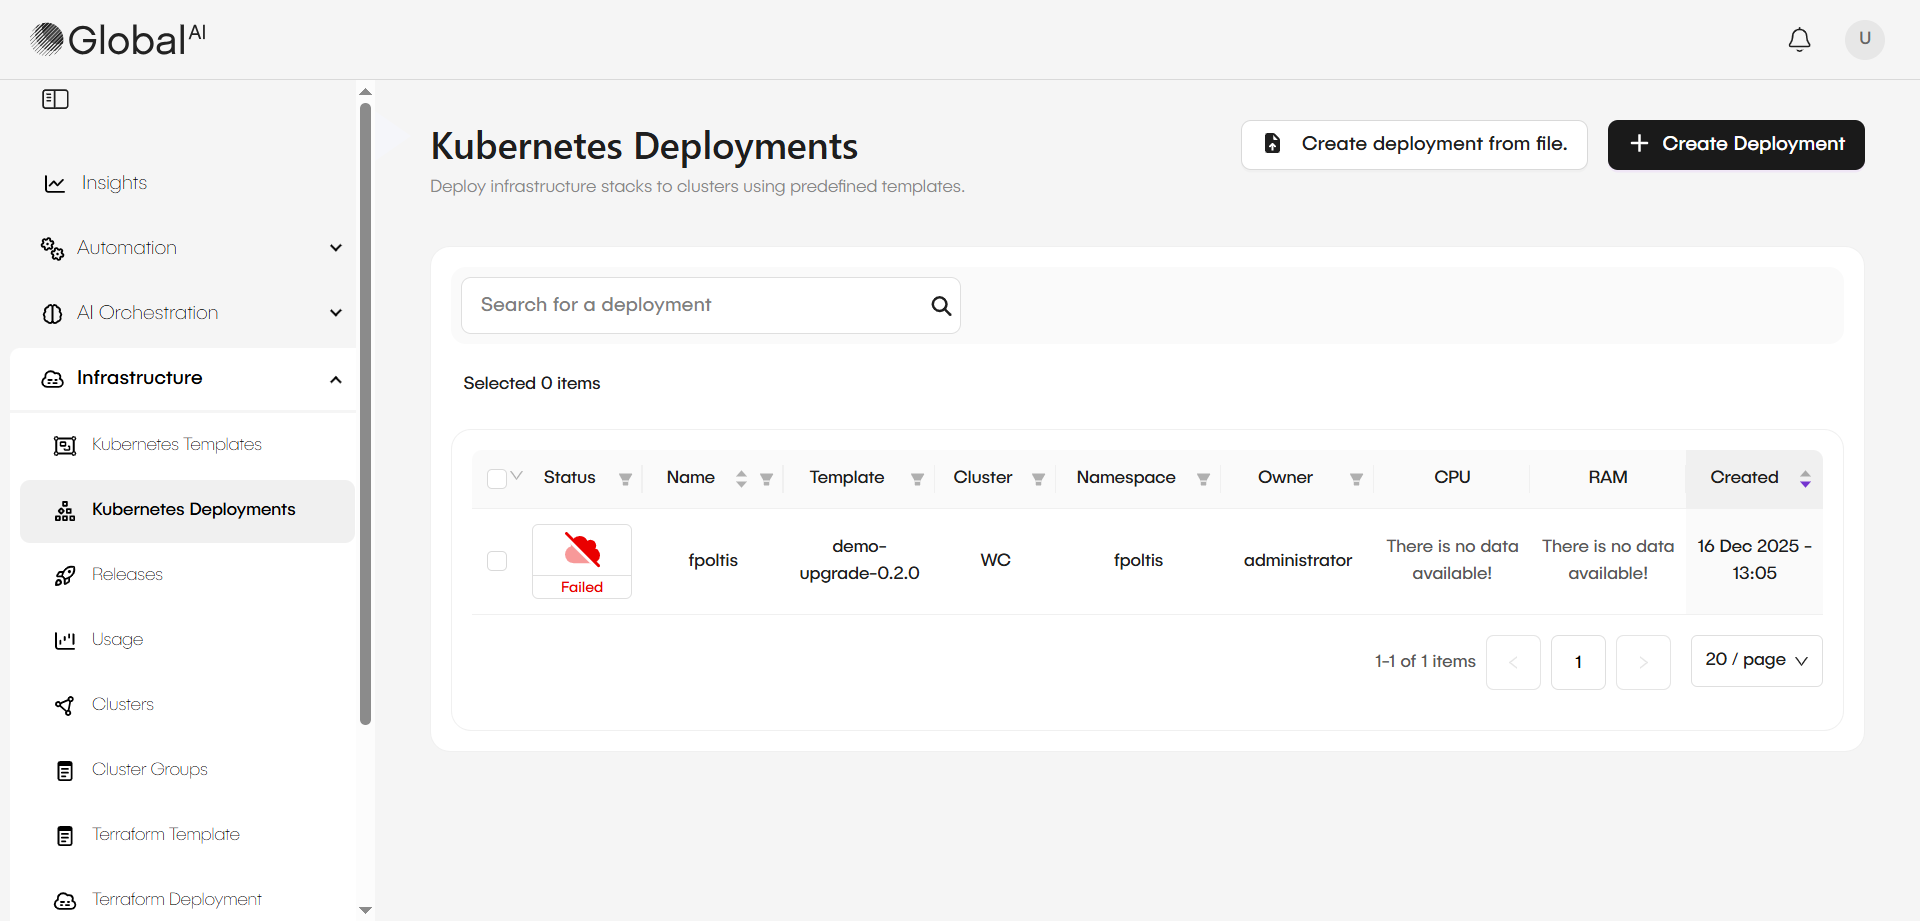
To check the current state of your deployments, navigate to the Kubernetes Deployments menu. The platform displays a list of all active deployments along with their real-time status.
Deployments use standard Kubernetes statuses to indicate their lifecycle stage:
- Pending: The deployment is waiting to create resources, such as a persistent volume, or is waiting to download a container image.
- In Progress: The system is currently starting up the pods.
- Running: The pods are up, running, and successfully responding to requests.
- Bound: Specifically for persistent volumes, this status indicates the volume has been successfully attached to the deployment.
- Failed: The deployment encountered a critical error and cannot proceed, often due to misconfigurations or insufficient cluster resources.
Access live manifests
You can view and update the actual configuration of a running deployment directly through the platform interface.
- Select a specific deployment from the Deployments list.
- Navigate to the Resources tab.
- Click Edit next to any specific resource (such as a pod or service) to view its manifest. The manifest is updated live from the Kubernetes cluster, providing the most recent status and configuration details.
Analyze individual deployment metrics
The platform tracks detailed metrics to help you understand resource utilization and associated costs for a specific deployment. To view this data, select a deployment and navigate to the Metrics tab.
The platform categorizes these metrics into several areas:
- Usage: Includes total cost, total active hours, total CPU cost, and total efficiency.
- CPU: Tracks average running CPU cores, cumulative CPU core-hours allocated, and average CPU core requests.
- RAM: Monitors average RAM allocated, RAM efficiency, and cumulative RAM byte-hours allocated.
Monitor global cluster usage and costs
For a broader view of financial and operational health, use the Usage menu under the Infrastructure section. This dashboard aggregates cost data across your entire environment.
In the Usage UI, you can:
- Filter by Time: Select specific windows to track spending trends over time.
- Group Data: Break down costs by Namespace, Node, Service, or Deployment to identify high-consumption areas.
- Track Cost Types: View specific breakdowns for CPU cost, RAM cost, and PV (Persistent Volume) cost.
- Analyze Efficiency: Compare actual resource usage against allocated costs to optimize your infrastructure footprint.
- Export Reports: Use the CSV icon to export your usage data for external auditing or financial reporting.
To ensure this dashboard displays accurate data, your clusters must be configured with a Prometheus URL for performance data and a Usage Service URL for cost-specific metrics.
Related articles
Now that you know how to monitor your deployments and metrics, you can explore these related guides.
Configure Kubernetes Clusters
Learn how to set up Prometheus and Usage URLs to enable detailed metric tracking.
Update & Upgrade Deployments
Discover how to update individual deployments or perform bulk upgrades across your entire infrastructure.
Import External Releases
Learn how to import and manage external Kubernetes application releases within the GlobalAI platform.